
A new option for the measurement booth.

Innovation in audio measurement.

Born from frustrations on site: measurement, correction, listening and remote viewing, together in one app.

Apply for the Beta programSee the Remote view demo

Accepting Beta participants · For macOS (Apple silicon) and Windows 10/11

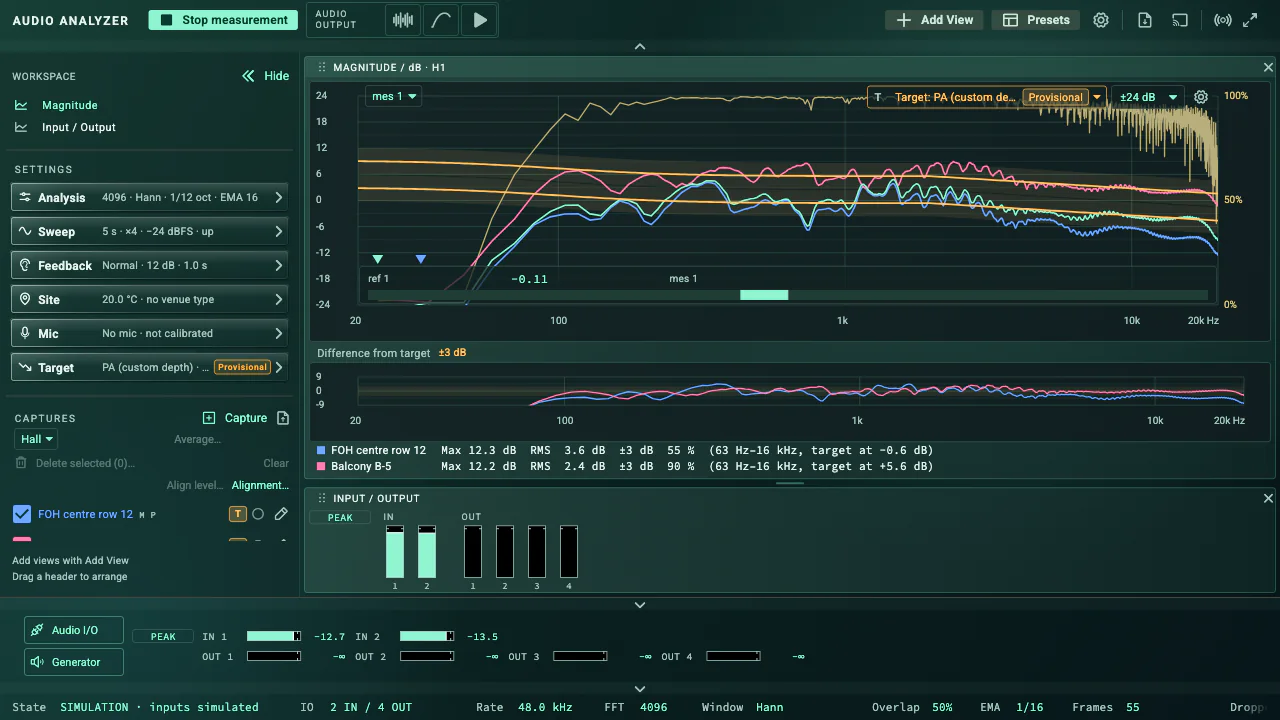
SBL Audio Analyzer magnitude graph: two Captures with a target curve and tolerance band, and the difference from the target below
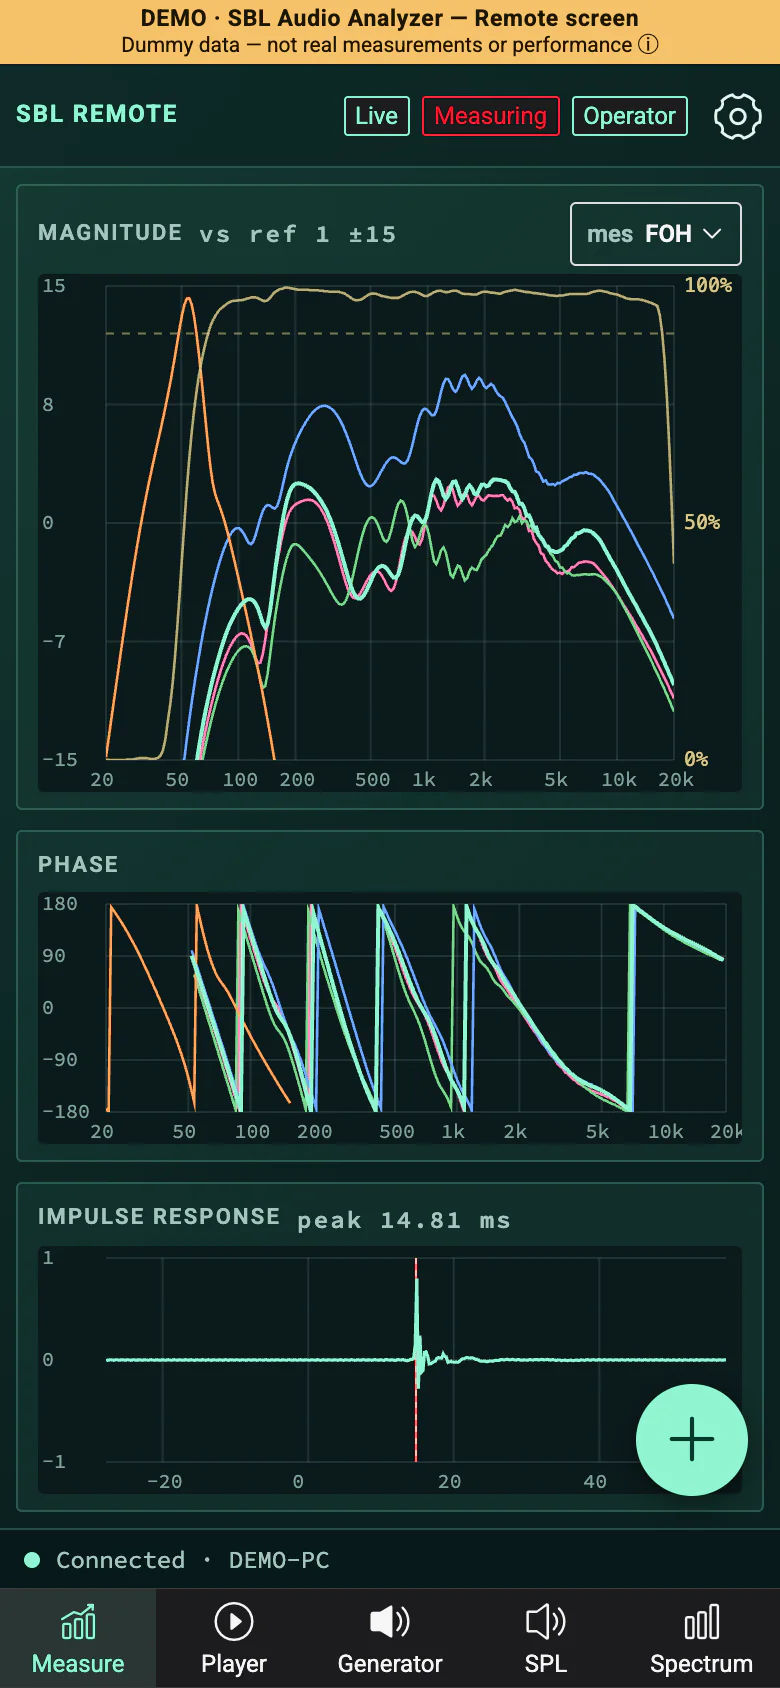
Remote view on a phone: magnitude with coherence, phase and impulse response stacked, five tabs at the bottom

Screens show dummy data.

ABOUT

From the sound booth and the web.

Built by a sound engineer and a web engineer, working as a team. Measuring, correcting and watching, in one app. The measurement screens also open in the browser on your phone or iPad.

01 · MEASURE

Measure

Compare the reference signal with the microphone to see how the system responds.

SBL Audio Analyzer magnitude graph: two Captures with a target curve and tolerance band, and the difference from the target below
Magnitude and coherence, with a target curve and the difference from it.

Transfer function, phase and coherence

From two inputs, the reference (loopback) and the measurement microphone, see magnitude, phase and coherence live. Coherence sits on the magnitude graph. Find the delay automatically and apply it. Run several measurement microphones and switch between them. Overlay as many saved Captures as you need.

  • MAGNITUDE
  • PHASE
  • COHERENCE
  • FIND DELAY
  • CAPTURE
  • SMOOTHING

Measurement accuracy is still being checked on real hardware (Beta).

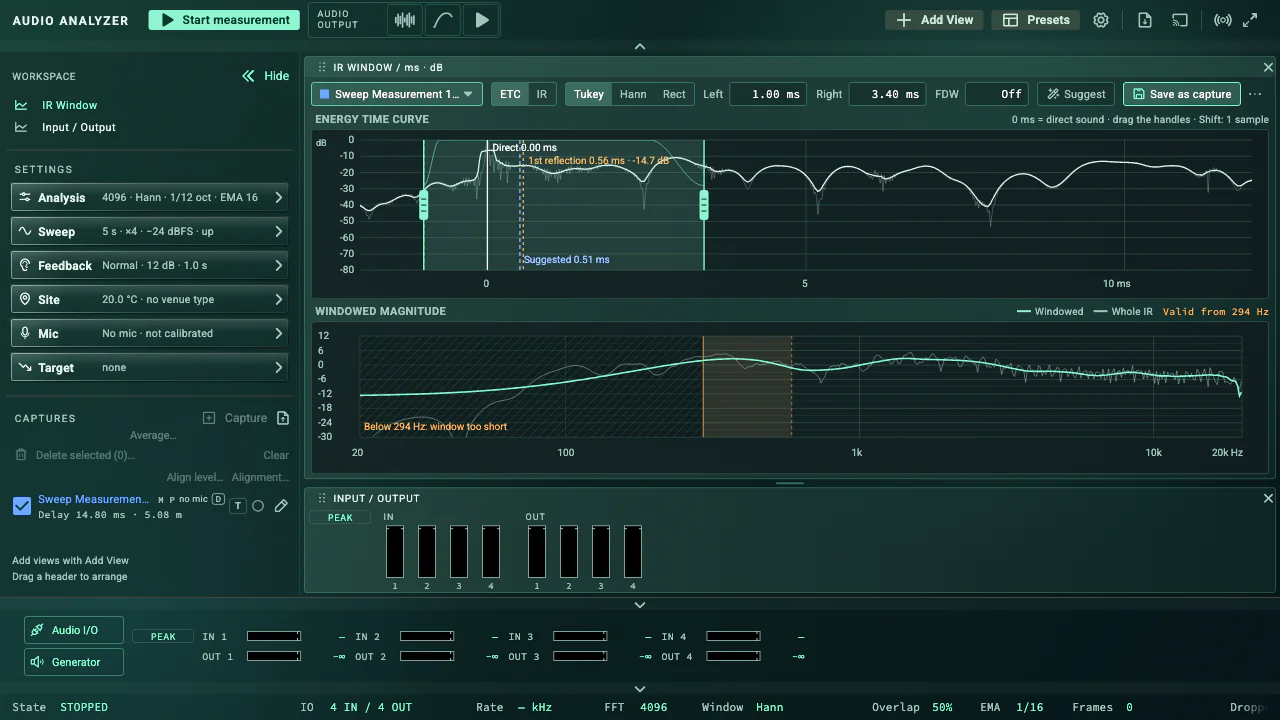
IR window: energy time curve with window handles above, windowed magnitude below
Select the span up to the first reflection and see the windowed response.

Sweep and IR

Measure with a logarithmic sweep and get the impulse response (IR). In the IR window, pick the span from the direct sound to the first reflection and see the windowed magnitude. A list of reflections with their time and path difference, and a group delay view. Save the windowed result as a Capture.

  • LOG SWEEP
  • IMPULSE RESPONSE
  • ETC
  • IR WINDOW
  • GROUP DELAY

Reverberation time (RT60 and similar) is in preparation.

02 · TUNE

Tune

Build a correction from the measurement, listen to it, then measure again to check.

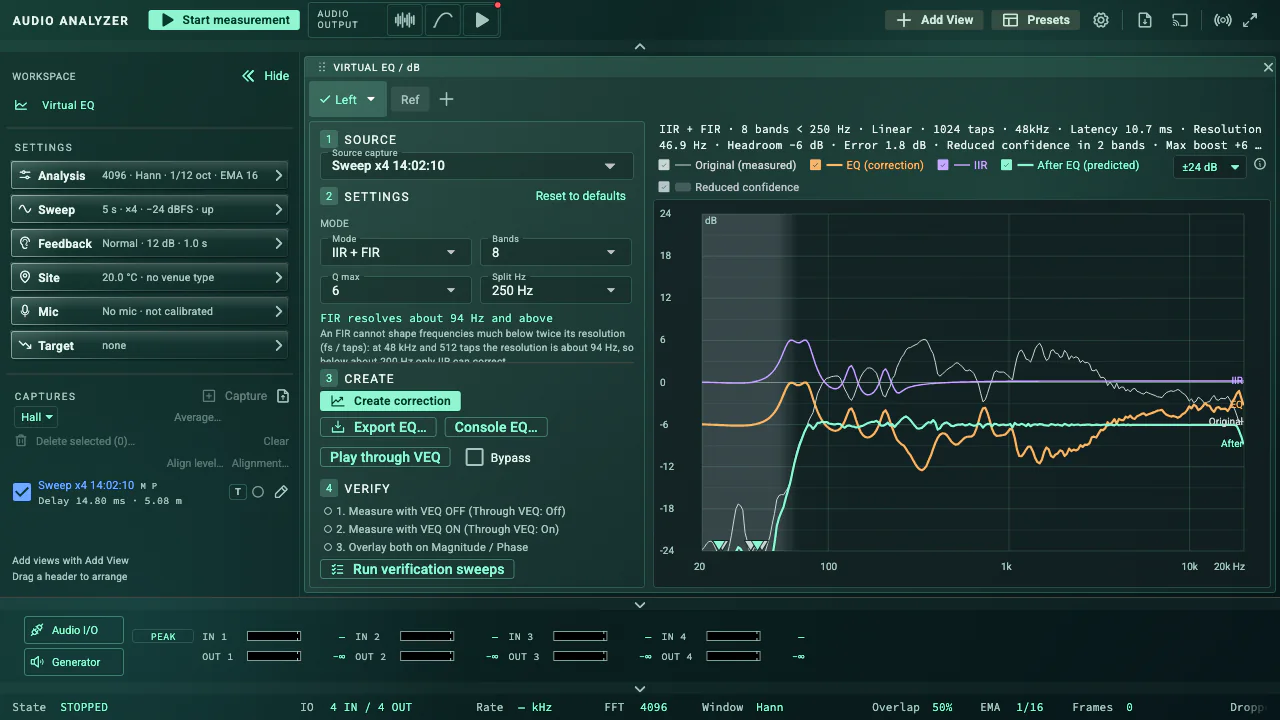
Virtual EQ: source Capture and settings on the left, original, correction and predicted response on the right
Build a correction EQ from a measurement and check the predicted result.

Virtual EQ (VEQ)

Build a correction EQ from a measurement: parametric (IIR), FIR, or both. See the predicted result on the graph. VEQ is an EQ inside the app; it does not change any settings on your equipment. Export files for processors or a sheet to enter by hand.

  • IIR
  • FIR
  • IIR + FIR
  • PREDICTED RESPONSE
  • EXPORT

Listen to the correction, then measure to check

Listen to the correction (VEQ) right away in the Audio Player, and switch it on and off at the same point in the track. Measure again with a sweep through the VEQ and compare it with the uncorrected response.

  • VEQ ON / OFF
  • LEVEL MATCH
  • VERIFY SWEEP

For listening, the correction is applied to the audio file before playback (not in real time).

Console EQ

Turn the correction into graphic or parametric EQ values for a mixing console, as a table to enter by hand. Choose the number of bands, gain range and step to match the desk. Nothing is sent to the console automatically.

  • GEQ
  • PEQ
  • INPUT SHEET
  • CSV

Some values for specific desks are still being checked on the hardware; the table and the exported files list them.

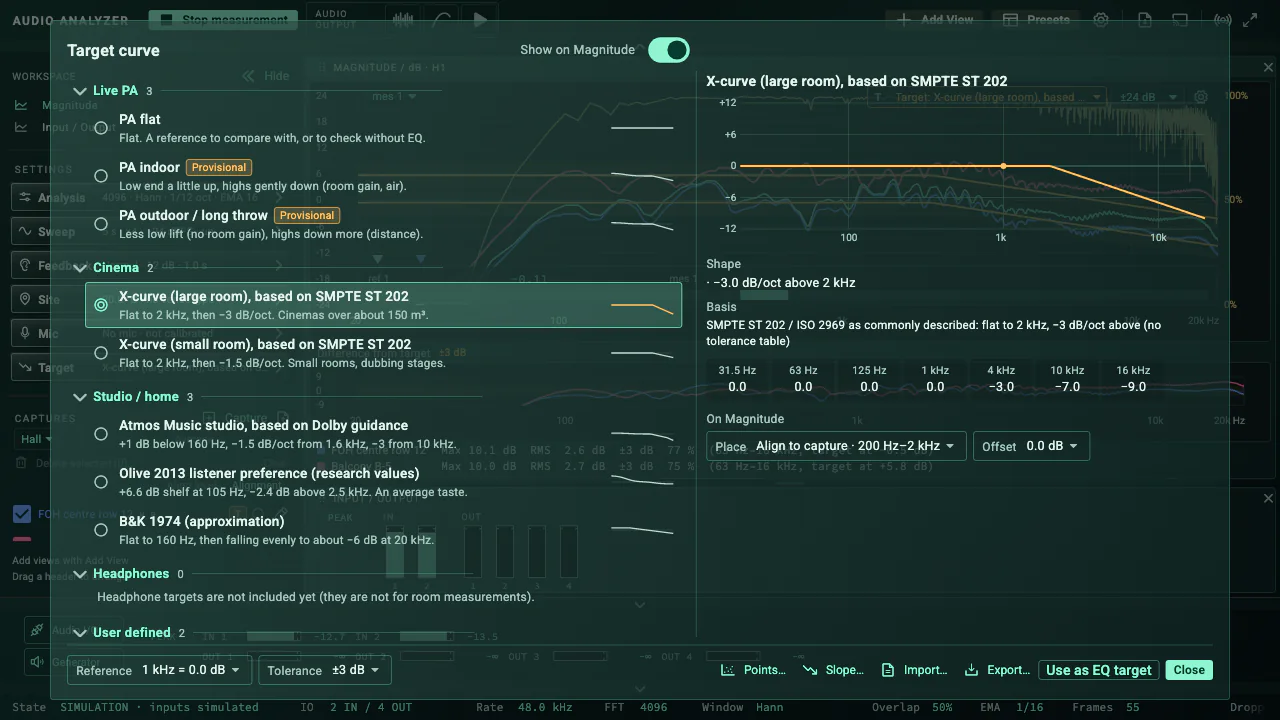
Target curve picker: curves listed under live PA, cinema and studio, with the shape and values on the right
Pick a target curve by use.

Target curves

Pick a target shape by use (live PA, cinema, studio, user defined) and overlay it on your measurement. The difference from the target sits under the magnitude graph. The live PA curve has two knobs for the depth of the lows and highs. Make your own curve by placing points or setting a slope, and use it as the VEQ target.

  • LIVE PA
  • CINEMA
  • STUDIO
  • USER
  • DIFFERENCE

The live PA values are provisional, to be confirmed on site. Cinema and studio curves are approximations based on published descriptions.

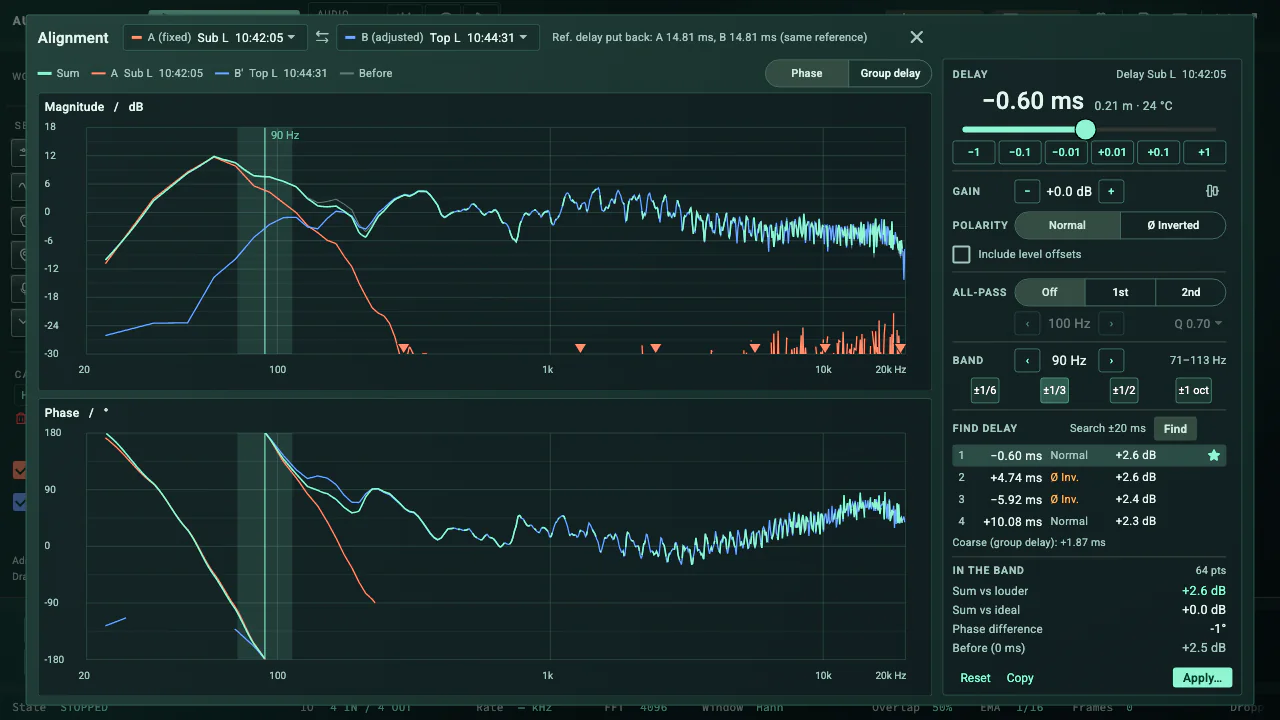
Alignment tool: magnitude and phase of two Captures and their sum, with delay, gain, polarity and candidates on the right
Set delay and polarity for subs and tops while watching the sum.

Alignment

Choose two Captures (a sub and a top, for example) and change delay, gain and polarity while watching the summed magnitude and phase. Search for delay candidates and keep the chosen values in the project and the report. Distance is worked out from the temperature on site.

  • DELAY
  • GAIN
  • POLARITY
  • ALL-PASS
  • SUM

The result is a calculation on the measured data; it does not change any settings on your equipment.

03 · WATCH

Watch

Keep track of the sound on screen, during the show too.

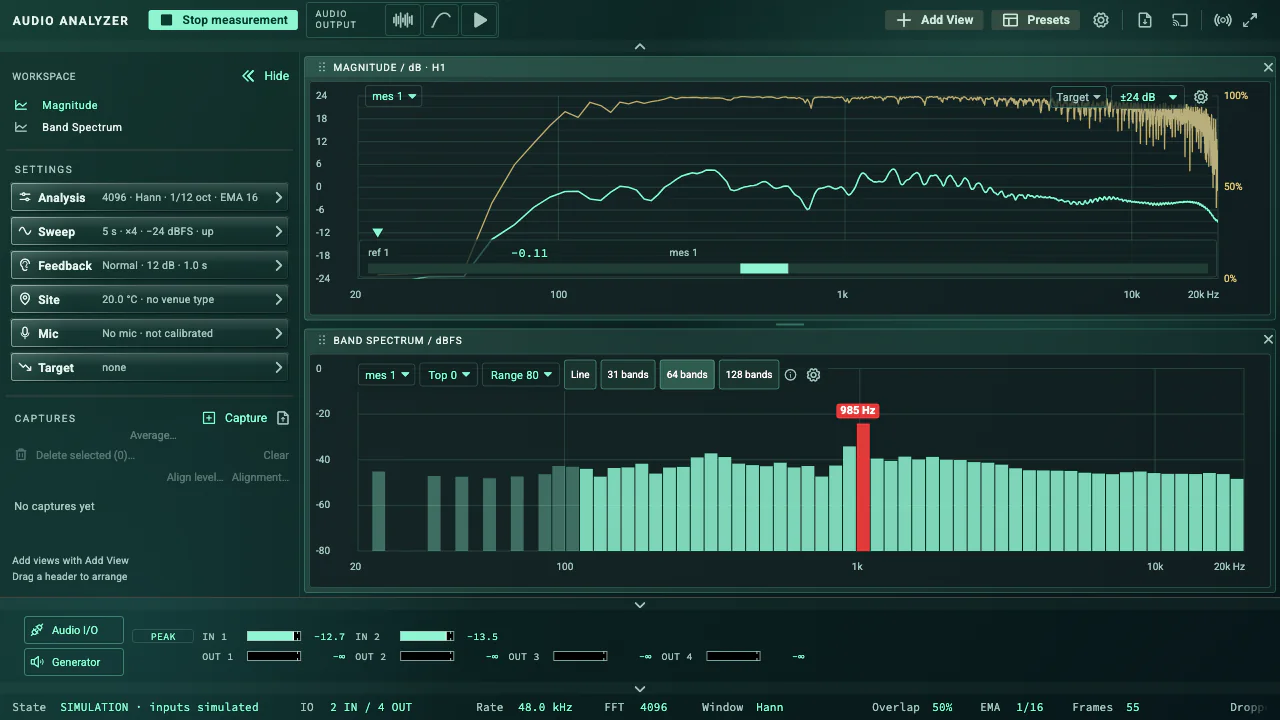
Band spectrum with one band marked in red and its frequency shown
A marker on a peak that stays and grows.

Early signs of feedback

Peaks that stand out, stay and grow in the spectrum get a marker. Choose a check that is less easily fooled by long, flute-like notes (Normal or Strict), or the plain Sensitive check. You can also keep the moments before and after a detection to listen again later (off by default).

  • NORMAL
  • STRICT
  • SENSITIVE
  • RECORD EVENTS

Detection is still being tested with real-world recordings (Beta).

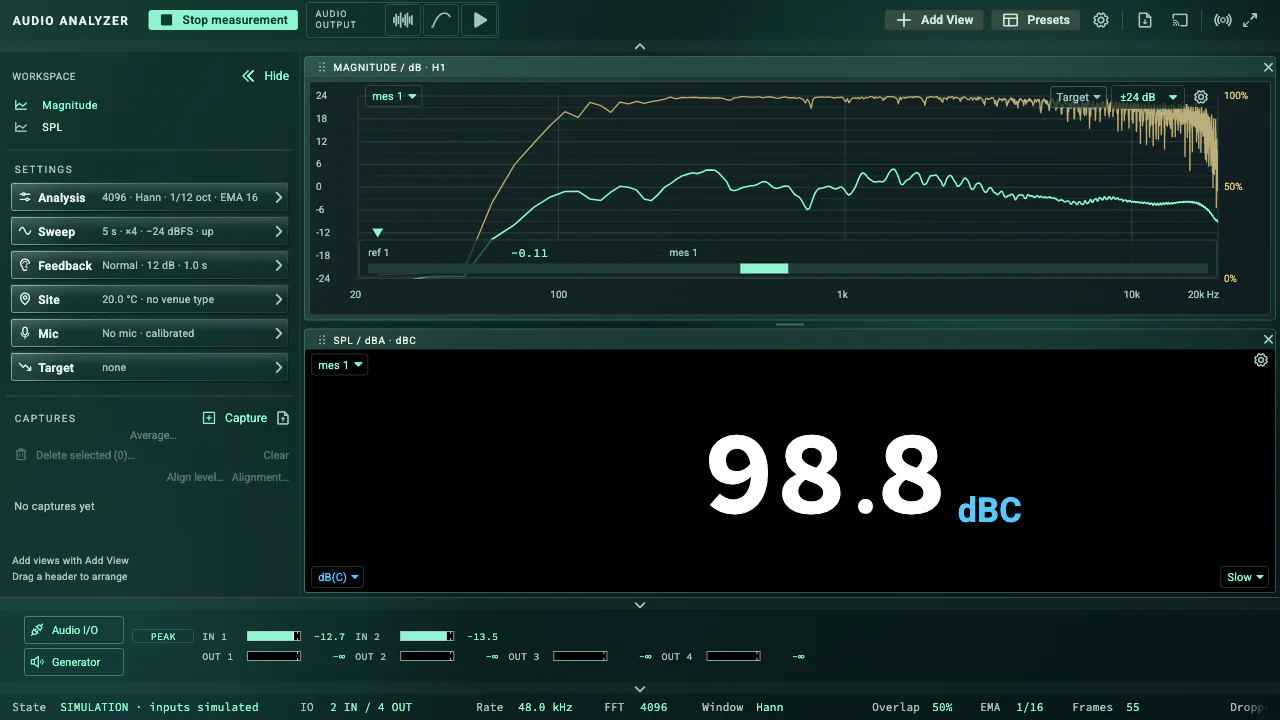
Magnitude graph with a large SPL readout below
SPL in large numbers; dBFS until calibrated.

SPL and Loudness

SPL with A, C and Z weighting and Fast or Slow, plus a graph over time. Colour alerts tell you when it gets too loud. Loudness, following ITU-R BS.1770 / EBU R128, shows Momentary, Short-term, Integrated and LRA.

  • dBA
  • dBC
  • dBZ
  • FAST / SLOW
  • SPL GRAPH
  • LUFS
  • LRA

SPL reads in dB SPL after calibration with a calibrator (dBFS before that). SPL calibration and loudness are still being checked against calibrators.

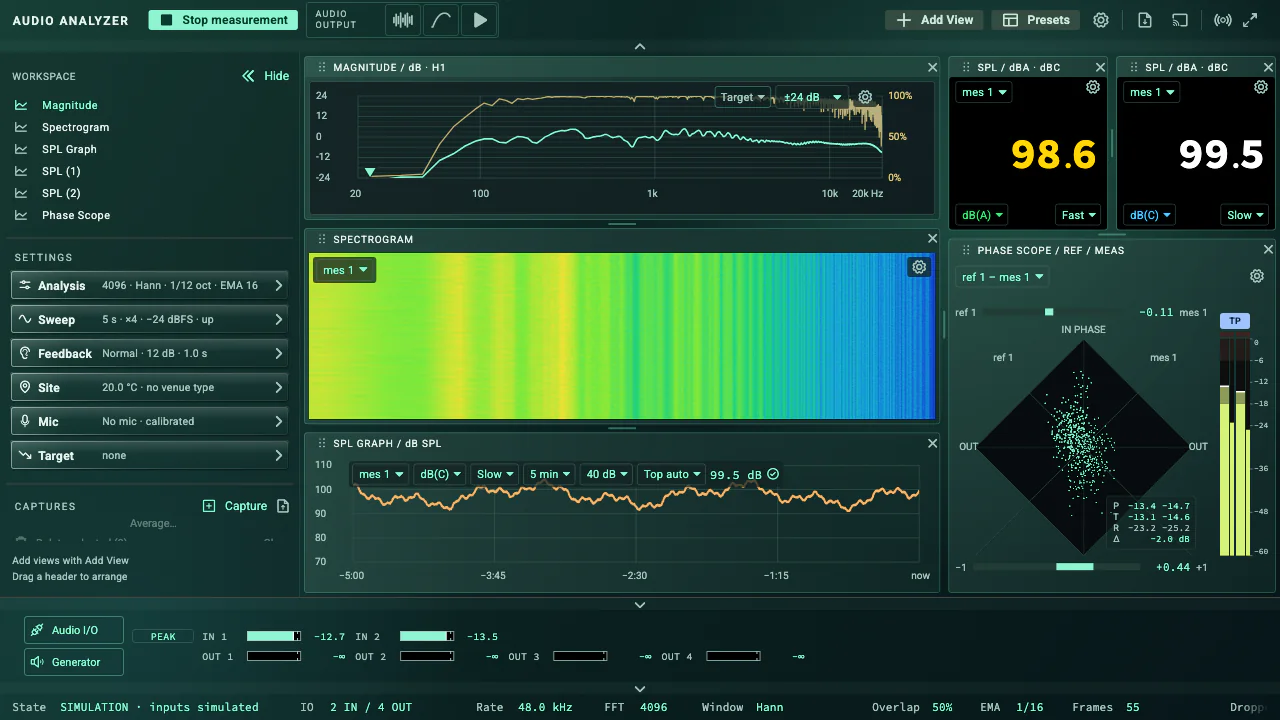
Phase Scope (diamond scope and vertical meters) beside magnitude, spectrogram, SPL and SPL graph
Phase relation, correlation and balance, next to the other views.

Phase Scope

See the phase relation of two signals on a diamond-shaped scope, with correlation, balance and levels. Spot reversed polarity or an off-balance pair. You can watch the Audio Player here too.

  • GONIOMETER
  • CORRELATION
  • BALANCE
  • PEAK / RMS

Audio Player

An Audio Player built into the measurement app, with playlists, waveform, loops and markers. Route it to an output and use it as a measurement signal. Compare the correction (VEQ) on and off here too.

  • PLAYLIST
  • WAVEFORM
  • LOOP
  • MARKERS
  • VEQ ON / OFF

04 · REMOTE

Watch from your phone

Leave the mix position and keep the measurement in your hand.

Remote view on a phone: magnitude with coherence, phase and impulse response stacked, five tabs at the bottom
Live transfer function and phase in your phone's browser.
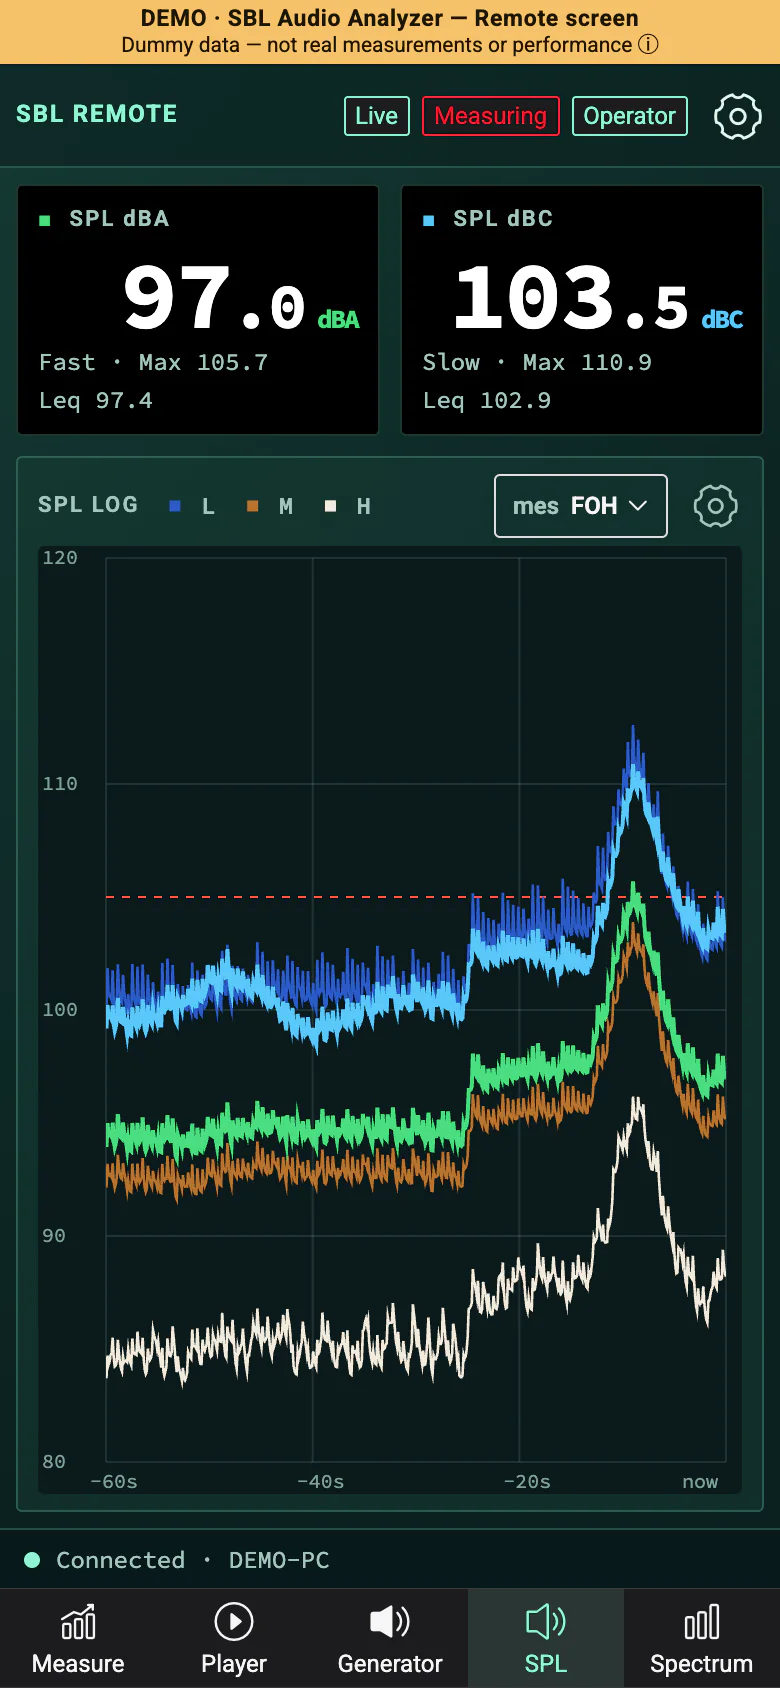
Remote view SPL tab on a phone: dBA and dBC readouts with an SPL log graph
SPL in your hand, too.

Screens show dummy data.

A Remote view that opens in the browser on your iPad or phone. It shows the live transfer function, phase, coherence and SPL. Nothing to install; use it on the same network. Enter the passcode and you can view (Viewer). Once the PC allows it, you become the Operator and can start measuring, take Captures, and run the sweep, the generator and the player.

  • BROWSER
  • PASSCODE
  • VIEWER
  • OPERATOR
  • iPhone
  • iPad

The Remote view runs only when you turn it on (it starts off). Testing on real iPhones and iPads is ongoing.

See the Remote view demo →

The demo runs on dummy data.

05 · WORKSPACE

Build your screen

The views you need, at the size you need.

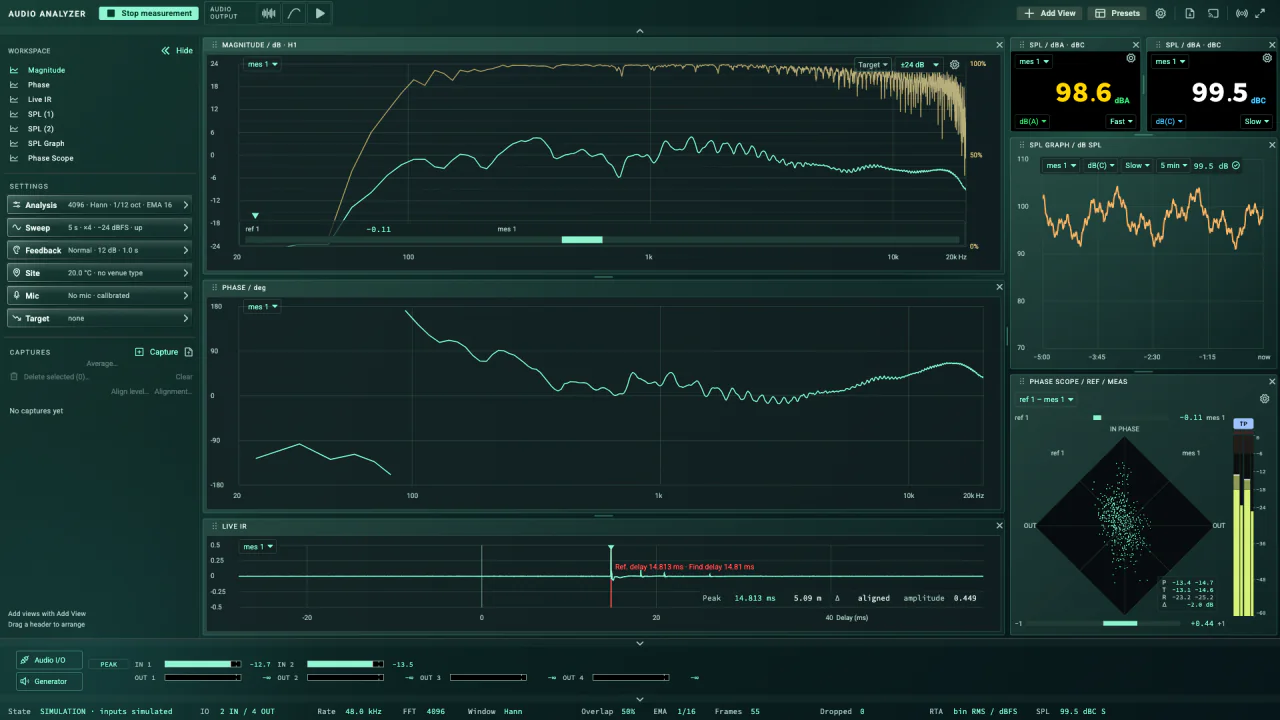
A 1920×1080 layout with magnitude, phase, live IR, SPL, SPL graph and Phase Scope
Arrange the views you need into your own screen.

Use Add View to place magnitude, phase, IR, SPL, spectrum, spectrogram, Phase Scope and more, then split, swap and resize them freely. Start from a preset for common layouts. Export results as an HTML report or as CSV and JSON. The app is in Japanese and English.

  • ADD VIEW
  • SPLIT
  • PRESETS
  • HTML REPORT
  • CSV / JSON
  • 日本語 / ENGLISH
<1>Live mode

For the show, switch to Live mode. The view title rows and the Add View and Presets buttons are hidden, so the views get more room. The controls for moving and closing views are hidden too, which makes it harder to change the layout by accident during the show.

  • LIVE MODE
  • HIDE HEADERS

In the field

LIVE

From setup to showtime.

Measure the transfer function with the reference and the mic, and set the delay. Align the subs and tops. Build a correction in VEQ against a target curve and enter it on the desk from the Console EQ table. During the show, watch for feedback and SPL, and check from the audience area with the Remote view.

STUDIO SETUP

Before you settle the layout.

Sweep each time you move the speakers and overlay the Captures. Separate reflections in the IR window and check group delay. Average Captures from several positions into one. Compare with a studio target curve.

MAINTENANCE

Compare with how it should sound.

Overlay a Capture taken the same way last time. Use the Phase Scope and the polarity switch to catch a reversed wire. See distortion (THD) from the sweep results (experimental). Export a report for your records.

What you need

  • A Mac with Apple silicon (M1 or later, macOS 12 or later), or a Windows 10/11 (x64) PC
  • An audio interface with at least two inputs (one for the measurement mic, one for the reference loopback)
  • A measurement microphone (phantom power from the interface if needed)
  • A loopback cable (output back into the reference input) and a feed to the PA
  • A Beta license file

Useful extras: a sound level calibrator (for SPL calibration), your microphone's calibration file, and an iPhone or iPad on the same network (for the Remote view).

No interface yet? Try the screens in Simulation mode (no sound, no real measurement).

Requirements

macOS
Mac with Apple silicon (M1 or later), macOS 12 (Monterey) or later
Intel Mac
Not supported
Windows
Windows 10/11 (x64). Available in the Beta (unsigned; testing is limited). An ASIO driver is required
Languages
Japanese, English
Remote view
Browser on an iPhone or iPad on the same network (testing on devices is ongoing)
License
License file during the Beta

FAQ

How do I join the Beta?

The Beta program is by application. Use “Apply for the Beta program” on this page to send your email address and a few details. We will review it and email you the details. Questions: support@showbuildlabs.com.

Does it run on Windows?

Yes. Beta participants also receive the Windows 10/11 (x64) version. Unzip the file and run Setup.exe. Because it is not code-signed, Windows SmartScreen shows a warning (choose “More info” → “Run anyway”). Your audio interface needs the manufacturer’s ASIO driver. Testing of the Windows version is limited. If you have a problem, write to support@showbuildlabs.com.

Does it run on an Intel Mac?

No. It needs a Mac with Apple silicon (M1 or later).

How accurate is it?

We are still checking it on real hardware. During the Beta, please use it together with your usual checks.

Does turning on Virtual EQ change my equipment?

No. VEQ works only inside the app. To use it on your equipment, enter the values from the exported files or tables.

Do I need to install anything for the Remote view?

No. Open it in the browser on an iPhone or iPad on the same network and enter the passcode. It works only while Remote is turned on at the PC.

What can I do from the Remote view?

By default you can view (Viewer). Once the PC allows it, you become the Operator and can start measuring, take Captures, and run the sweep, generator and player.

Can I try it without an interface?

Yes, in Simulation mode you can try the screens and controls. No sound is played and nothing is measured.

Which languages?

Japanese and English.

Where do I send bug reports or requests?

Write to support@showbuildlabs.com.

Now accepting Beta participants.

The SBL Audio Analyzer Beta is by application. After reviewing it, we will email you the details.

Apply for the Beta program

Contact: support@showbuildlabs.com